2022 Water Quality Maintenance Plan | City of Markham, ON, Canada
This project is to develop a Water Quality Maintenance Plan
in the City of Markham for the purposes of ensuring that disinfectant residuals
in the watermain system are maintained following its initial construction and
commissioning. This work is largely
driven by the implementation of a large diameter (750Ø) trunk watermain along
Warden Avenue extending northerly from Major Mackenzie Drive to Street E (see Figure 1),
and for which there will be a relatively large volume of water with potentially
little-to-no turnover until such time that sufficient demand is present in the
system and/or connectivity to other parts of the City’s broader system is
established.
In this project, the residual disinfectant (total chlorine) concentration is determined as the minimum of the last week (7 days) of the 28-day simulation period. If the residual disinfectant concentration is at or below a threshold target (0.75 mg/L for the base case), an iterative process is followed to develop a flushing program including:
·
The identification of hydrants, blow-offs or
automated devices to be used for flushing.
·
The frequency at which flushing is anticipated
to be required.
·
The volume of flushing required.
Figure 2 presents the list of scenarios as added directly to the City’s InfoWater model. A total of 20 scenarios, including the four main scenarios, one water age sub-scenario and three additional sub-scenarios each, were tested. The sub-scenarios were investigated using a heuristic and iterative process to evaluate the residual disinfectant concentrations, water ages and required frequency and volume of flushing for the threshold targets of 0.75 mg/L, 0.50 mg/L and 0.25 mg/L.

Figure 1: City of Markham 2021 calibrated water quality hydraulic InfoWater
model including Berczy Glen development (added model portion in dashed red box).


Figure 3: Relationship between annual flushing volume and target
disinfectant residual concentration.

Figure 4: Scenario 1A modelling results without
flushing. Minimum total chlorine concentration (mg/L) at the end of the
simulation period
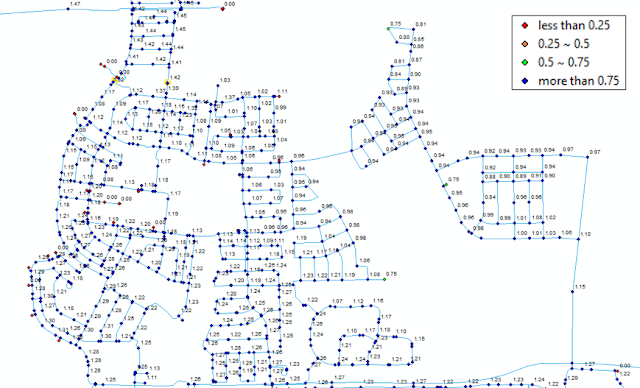
Figure 5: Scenario 1A modelling results
| Flushing to maintaining minimum total chlorine concentration of 0.75 mg/L, Minimum total chlorine concentration (mg/L) at the end of the simulation period


Comments
Post a Comment